46
aqueous phase (MC) and fecal coliforms (FC) were determined by standard methods (APHA,
1998; NOM-127-SSA-1994)
Plant growth and productivity.
Stems of the plants were measured each 30 days to evaluate the
plant growth. After 90 and 60 days for FW1 and FW2, respectively, the biomass of both plants
grown in three boxes (one box in each side of the FW and one from the center) was harvested in
each FW to determine productivity. Dry weight was also determined. The relative growth rate of
plants (RGR) was calculated according to Olguín et al. (2007). Productivity was calculated from
a mixture of roots and stems of both plants, since they grew making an inseparable matrix.
Results
Nutrient removal.
After three months of the establishment of FW1 (November), the water
quality improved especially in terms of COD (71.72%) and N-NH
4
(27.27%), while the maximal
N-NO
3
removal was observed in winter (January) (61.42%). TDS were removed in an average of
39.75±5.27% during autumn (October and November) and winter (January). In the case of FW2,
COD removal was higher in autumn than in winter (52.22 vs. 5.2-24.76%) The contents of BOD,
N-NO
3
and N-NH
4
-N found in the water taken in the front and in the back of FW2 were lower
than the maximum limits recommended by US-EPA, for November and December. With
exception of the inlet stream of the first lake, microcystin tests resulted positive in all samples;
however, none of the values obtained was above the maximum permissible level of 1
µ
g·L
-1
(WHO, 2008). On the contrary, the amount of fecal coliforms was above the recommended level
for waters for recreational use.
Plant growth and productivity.
P. sagittata
and
C. papyrus
adapted very well to floating
conditions in both FWs. They grew with a healthy appearance throughout the experimental
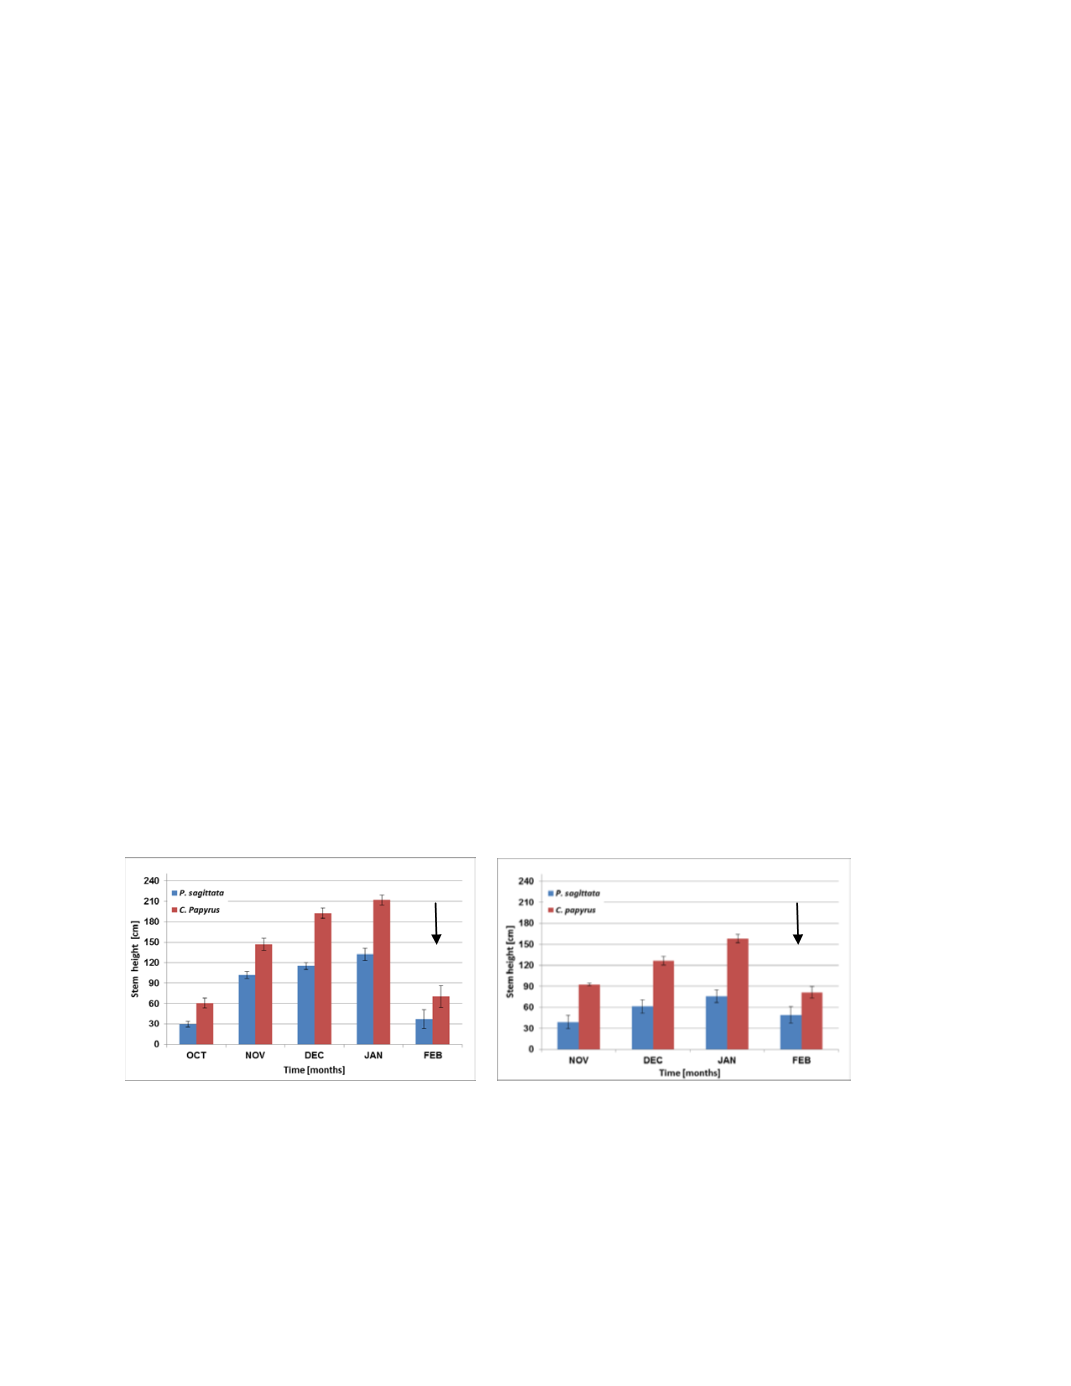
period in bothwetlands. In the case of FW1 (Fig.1), the highest stem height was observed in
January after 90 days of growth since they started in mid-September. In the case of FW2(Fig. 2),
the highest value was observed also in January but only after 60 days of growth since they were
established in early November. Hharvest dates are represented by arrows.
Fig. 1. Biomass growth in FW1. Fig. 2. Biomass growth in FW2.
The RGR calculated values are shown in Table 1. The higher values obtained in FW1 are related
to the seasonal effects since light intensity and temperature were higher in this case during the
first two months.


