28
where a pump was disposed to feed willow-CW. The effluent was discharged to a ditch leading to
a storm sewer.
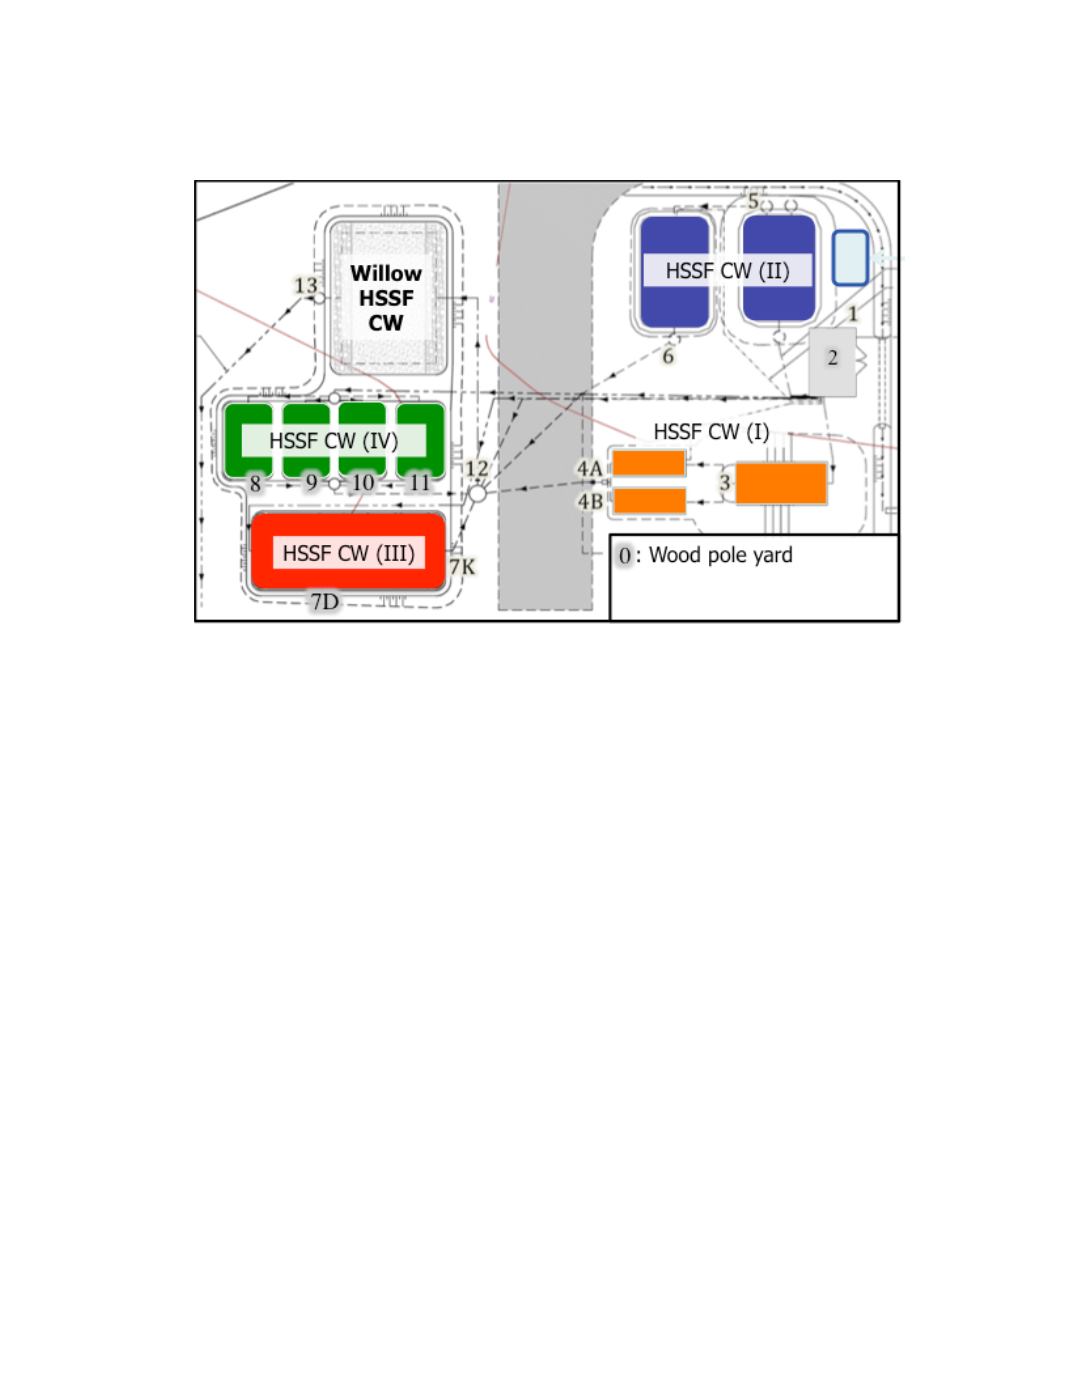
Figure 1: Schematic representation of the experimental site (numbers represent sampling point)
Data collection:
Flow rate and pump operating time were recorded at the inlet and outlet of the
willow-CW. A weather station was installed on-site to collect meteorological data to determine
reference evapotranspiration (ET
0
) according to the FAO Penman-Monteith method (Allen
et al.,
1998). Samples were taken monthly from the combined HSSF CW effluents at the inlet of the
willow-CW (point A) and from the willow-CW effluent (point B).
Chemical analyses:
Samples were sent to a commercial laboratory (AGAT) for the
determination of metals, phenolic compounds and dioxins and furans. Pollutants biosorption was
also been investigated through the analysis of the willow tissues.
Plant features:
Aboveground biomass dry weight, stem length and density were measured in
November 2012. Root development was monitored by 360º belowground images captured with a
root scanner (CID-600) in transparent acrylic tubes buried in the willow-CW.
Results and discussion
The four HSSF CW pilot units (I, II, III and IV) were efficient to remove chlorophenols and
metals with effluent concentrations below the detection limits (i.e. [chlorophenols] < 1 μg/L; [As]
< 0.02 mg/L; [Cd] < 0.01 mg/L; [Cu] < 0.1 mg/L). The main function of the willow-CW was to
treat the remaining D&F. The leachate, influent and effluent willow-CW D&F concentrations are
presented in Table 1.


