29
Tecnología y Ciencias del Agua
, vol. VIII, núm. 3, mayo-junio de 2017, pp. 27-37
Aburto-Medina
et al
.
, Prevalence of
Enterobacteriaceae
and contaminants survey in sediments of the Atoyac River
ISSN 2007-2422
•
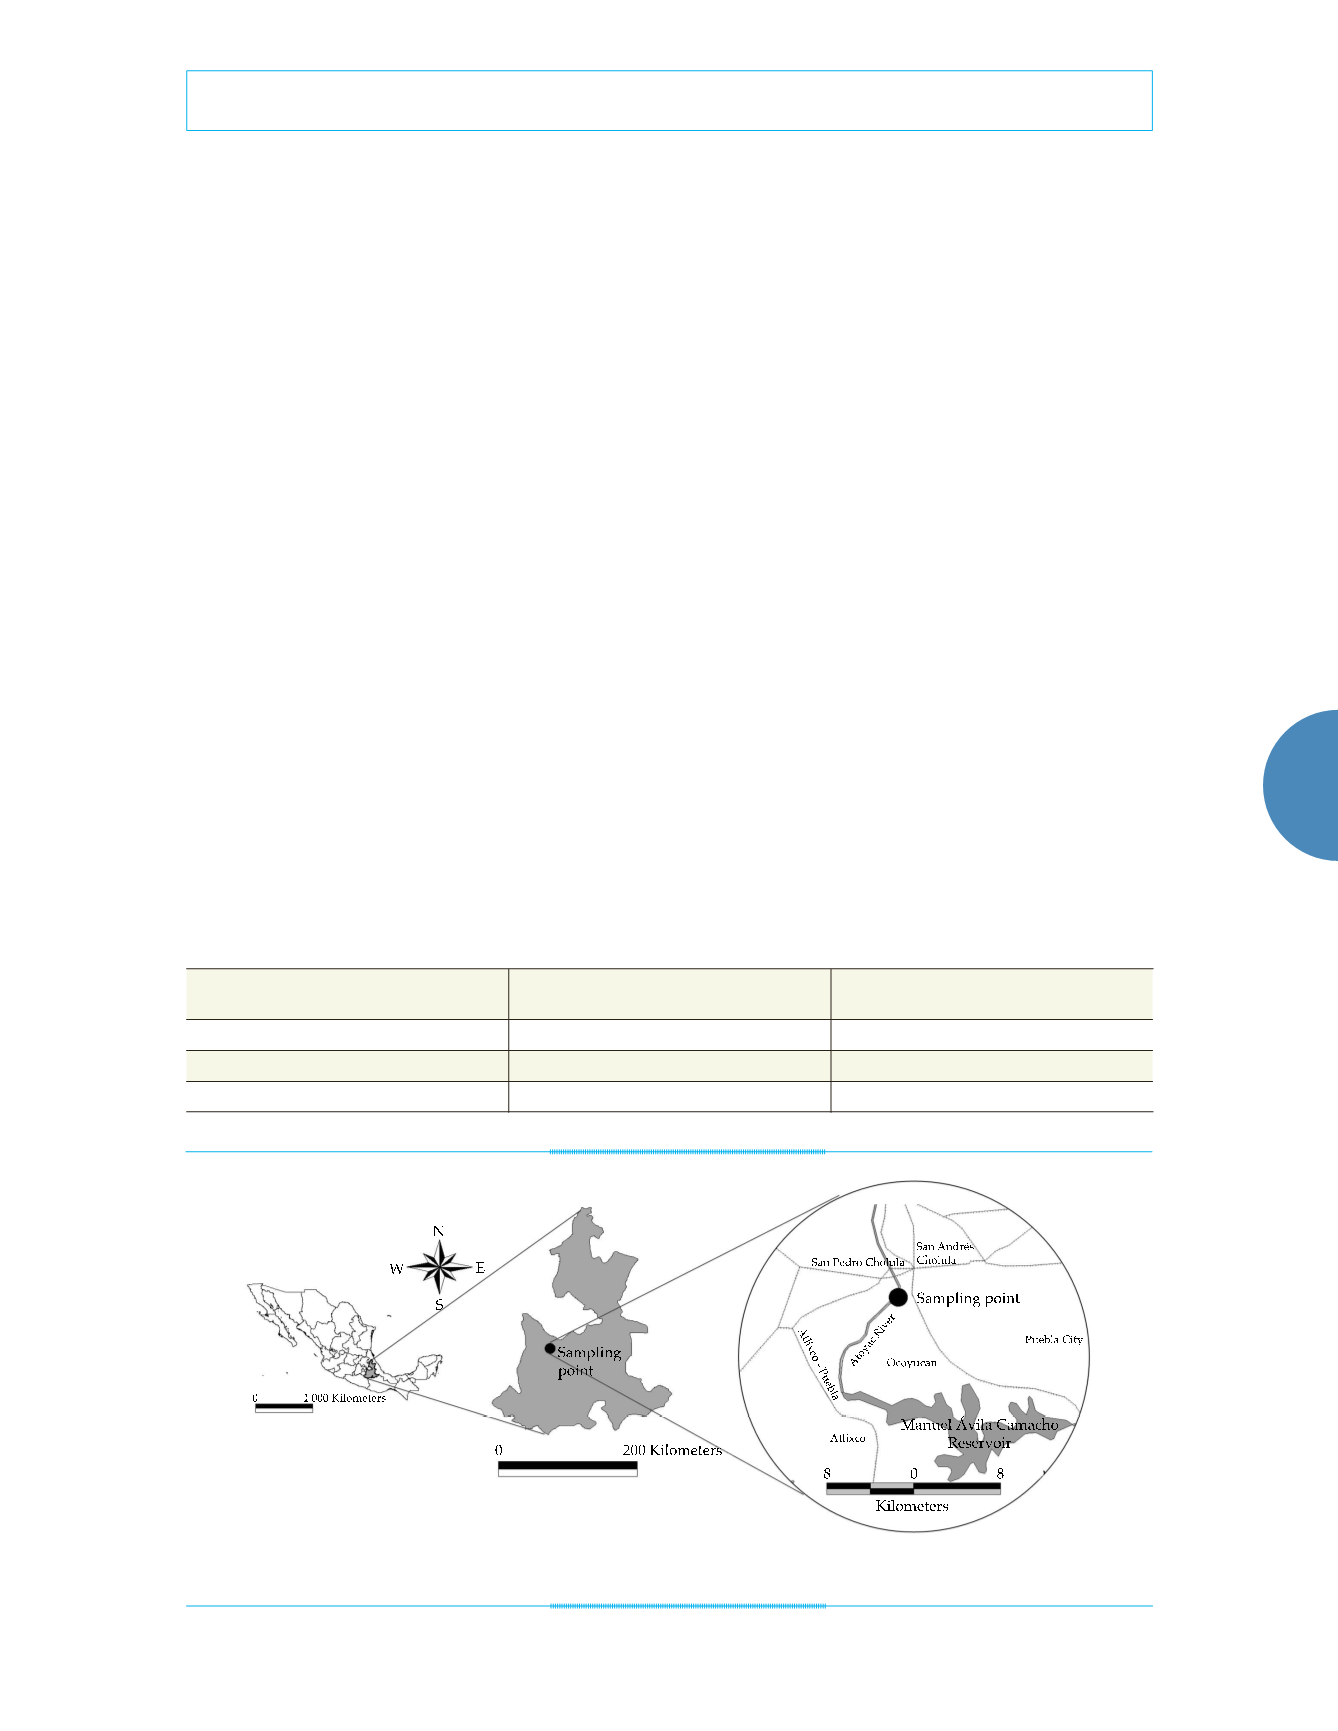
Site description and sampling
Sediment and water samples were collected
from three different positions (A1-A3) located
just prior the Valsequillo dam in central México.
The river water at these positions has undergone
wastewater treatment processes after receiving
industrial and domestic effluents along the river
course. The global positioning coordinates for
the sampled sites and the relative position of
the samples are indicated in table 2 and figure
1, respectively. The samples were collected dur-
ing the dry season on 21 January 2013. Water
samples were collected in sterile 1-litre glass
bottles. Sediments from the bottom of the river
were collected in 50 ml sterile centrifuge tubes.
Then, they were immediately preserved in dry
ice and protected from light.
Determination of elements in sediments
The sediments were dried to room temperature
to prevent any volatilization. Each sample was
homogenized and then a representative portion
was milled with a mortar prior to passing it
through a 60-mesh sieve before a further ho-
mogenization. The total element concentrations
(As, Pb, Ca, Fe, K, Ti, Sr, Ba, Mn, Zr, Zn, Cu, Rb,
Mo) were determined in 15 g of dried sediments
following the Unites States Environmental Pro-
tection Agency Method 6200 (USEPA, 2007a),
using a field portable X-Ray fluorescence Ana-
lyzer (FPXRF), NITON XL3t Thermo Scientific.
Two reference materials were used to establish
the method accuracy: the Standard Reference
Material “NIST 2710” Montana Soil and the
Reference Material unstratified glacial deposit
Till-4. The accuracy percentage of all elements
was in the 80 – 120 % range. Moreover, duplicate
analyses were performed to establish the method
precision and the relative difference percentage
(% RDP) was always below 10%. To discard con-
tamination interferences, blanks were analyzed
between each interest sample. The analysis of
clean quartz dioxide matrix (blank) was always
below the detection limit for all elements.
Figure 1. Location of sampled site. GPS coordinates of the sampling sites are shown in table 2.
Table 2. Coordinates of the sampled sites collected by GPS.
Code
GPS positioning
Elevation
(m)
A1
N19°1´31.55´´, W98°13´27.78´´
2092
A2
N19°1´18.48´´, W98°13´43.21´´
2092
A3
N19°0´56.00´´, W98°14´47.00´´
2093


